Last year was the year that I tried to communicate within myself. For the whole year, I decided to write down daily about how I felt every day. This personal work was inspired by the Happiness Calendar project by Happinessisthailand.
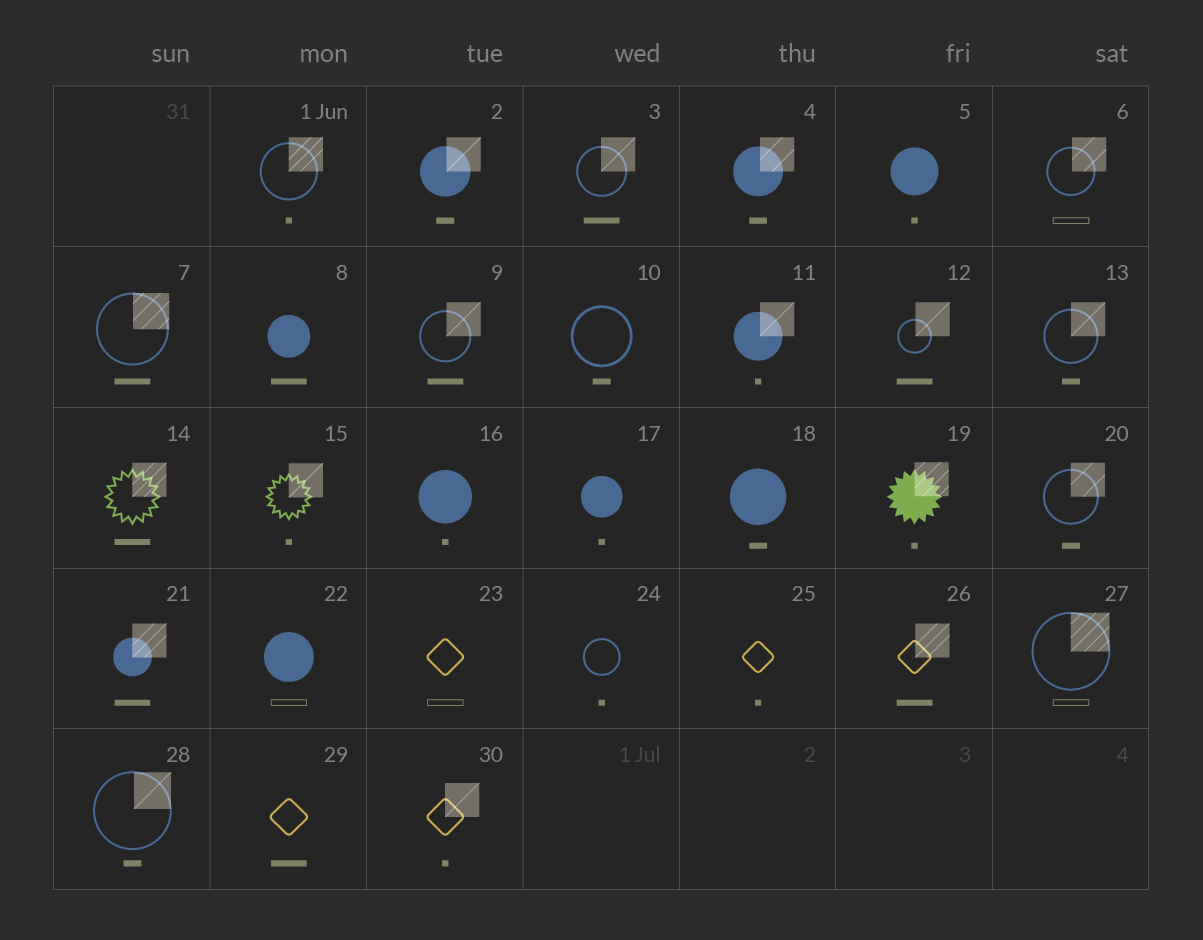
I tracked self-emotions each day by painting designated colours of my feelings to the calendar. At the end of the project, I would like to picture my daily record as a data chart which I believe will make me see the big picture of my 2019 emotions more clearly.
Collecting Process
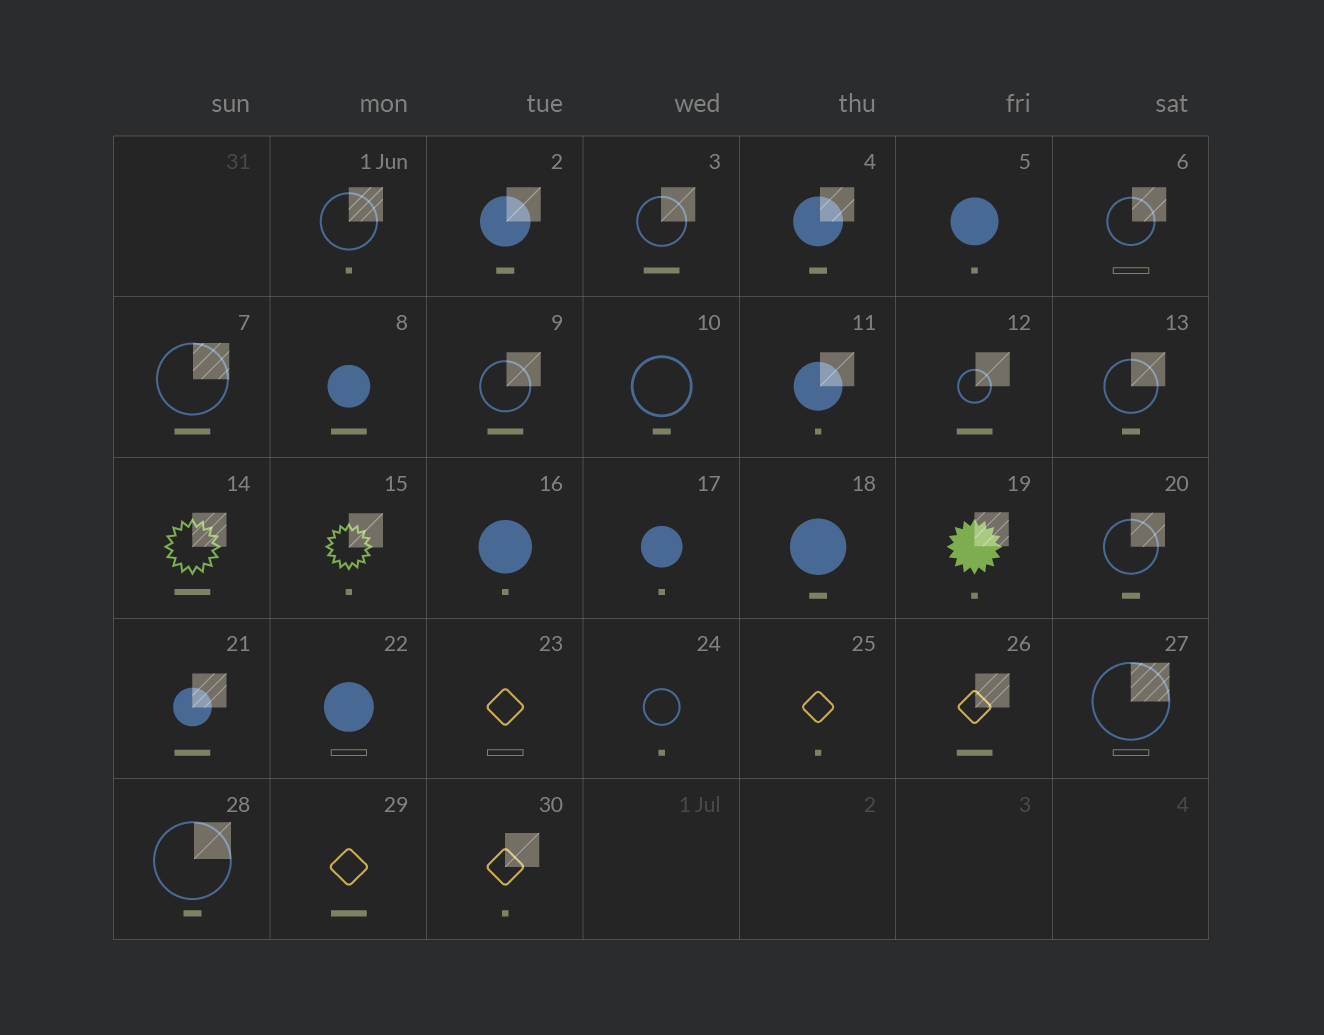
At the first start, I simply use the physical calendar for daily record but at the end I transfer all data into the Excel. This digital sheet makes data management easier.
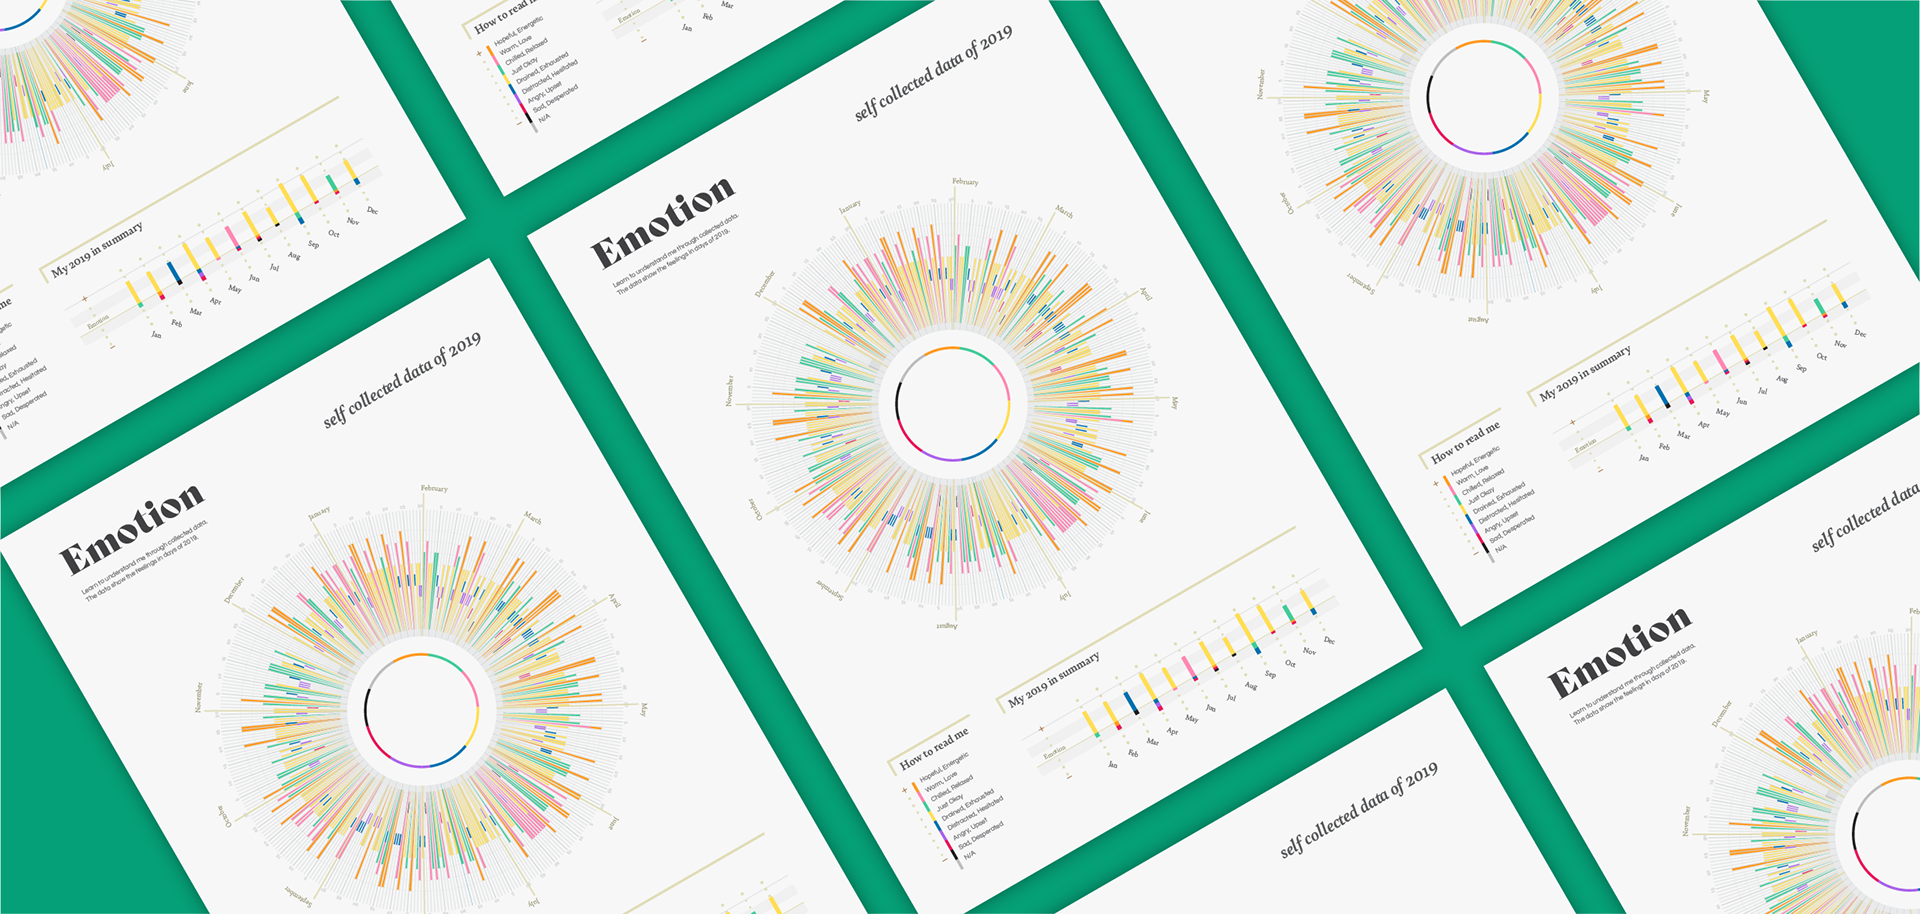
Design
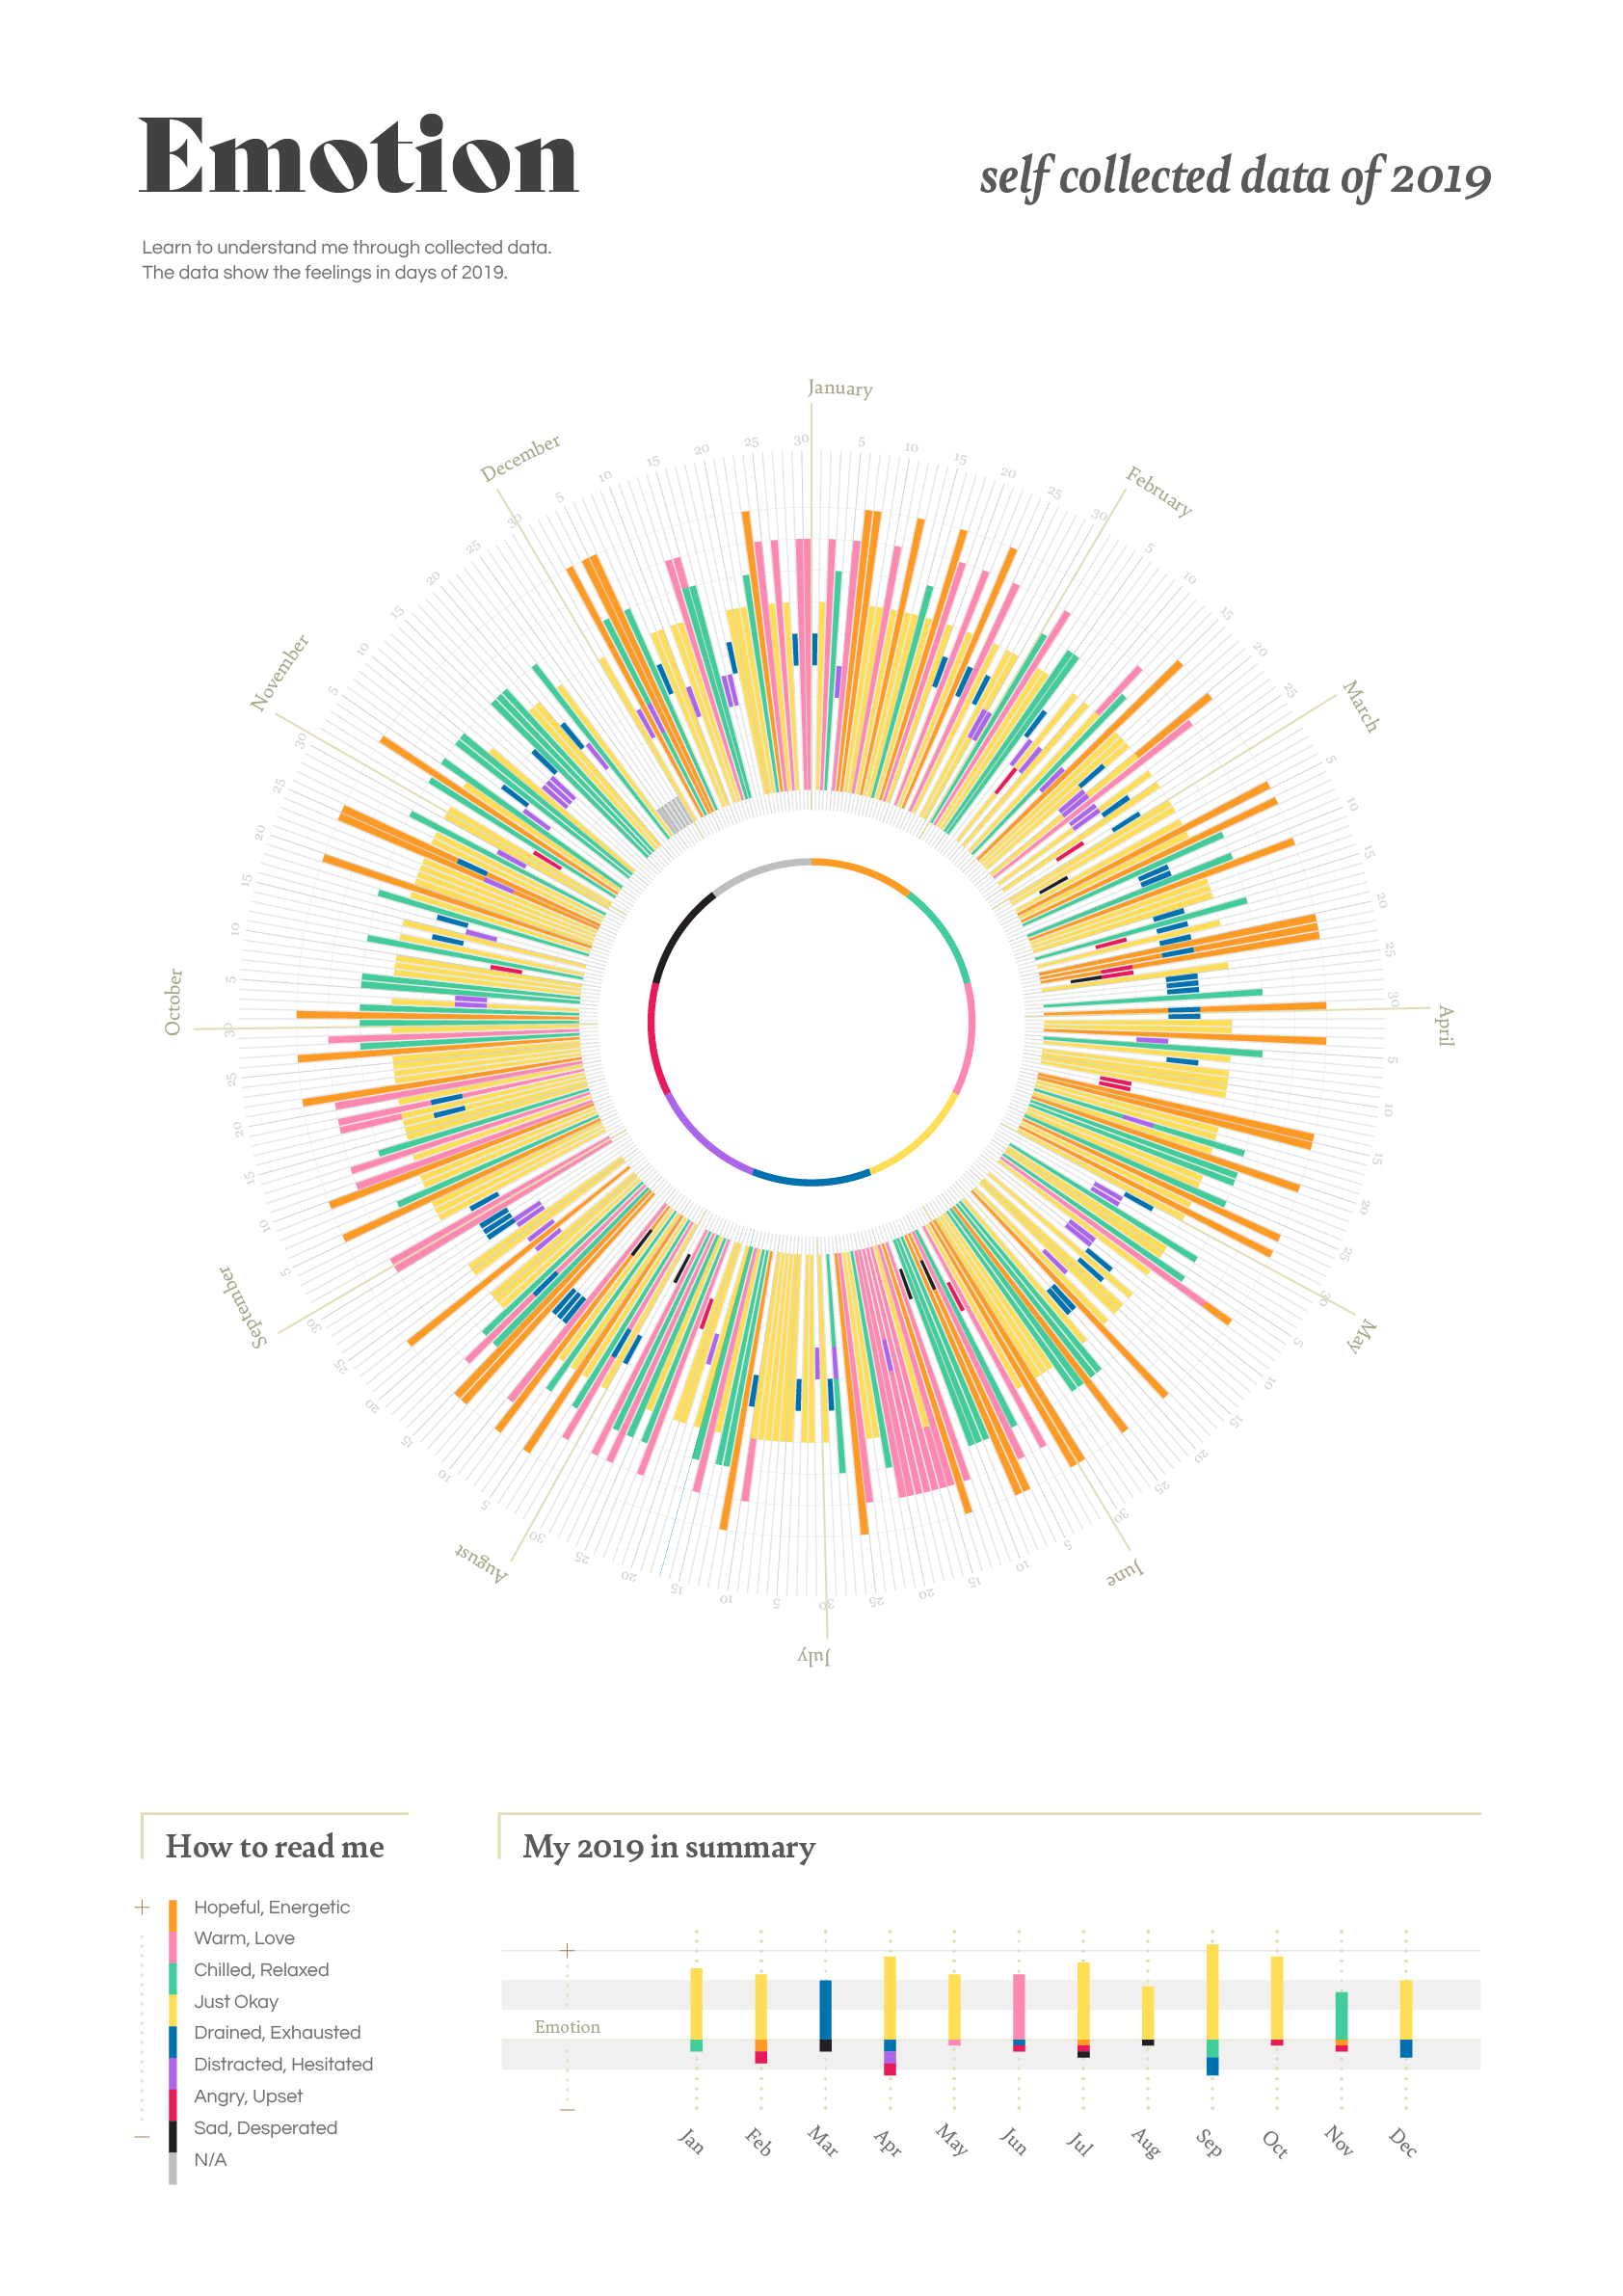
This 2019 year calendar chart was designed to read by following the circle curve. It starts from January at the top centre then going clockwise to the next month. The bar moods were divided by colour and length from positive to negative feelings. Each colour had its own meaning. Orange, pink, green, and yellow for good to normal moods. Blue, purple, red and black for the opposite. I also added grey for days I forgot to record.
Data Analysis
The highest data showed 130 days, being okay in yellow. In summary, this took 9 out of 12 months highest score, followed by chilled and relaxed green for 60 days. Lastly, the smallest emotion was 6 days of sadness in black colour.
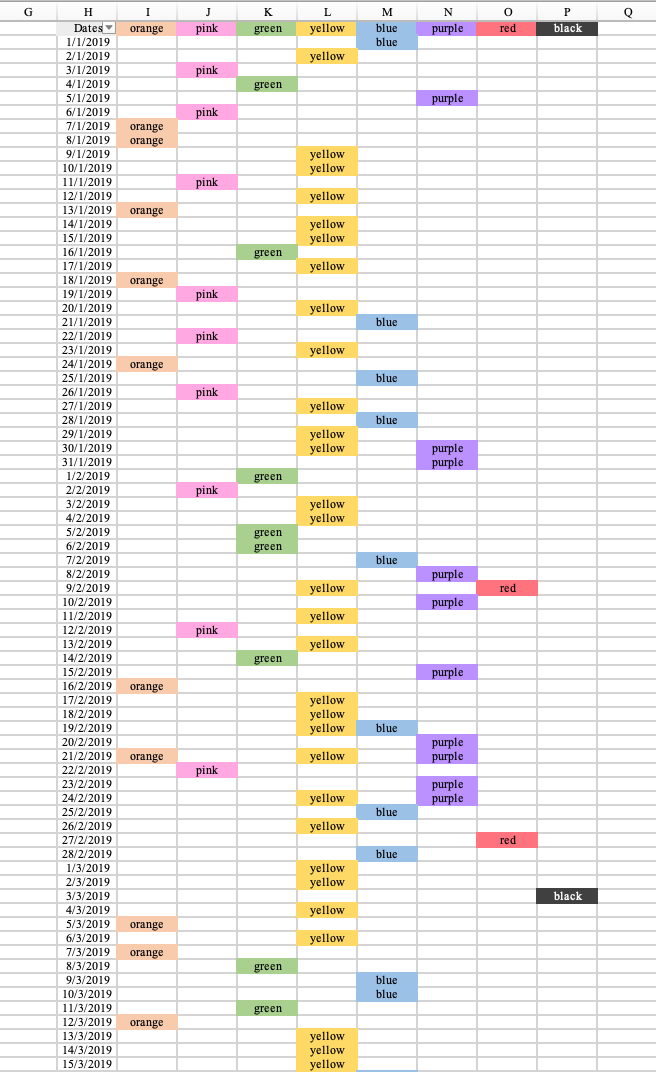
Transfer to digital data